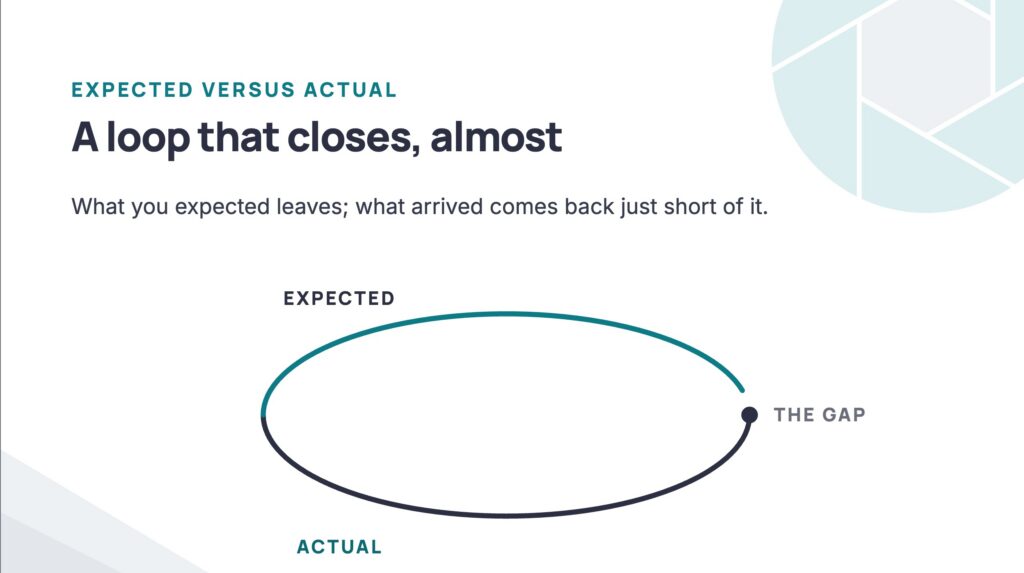
Month end arrives and somebody rebuilds the claims picture from scratch. Again. The reconstruction takes two days, produces a number nobody disputes, and answers none of the questions that mattered in March.
The alternative is not a better spreadsheet. It is recording what you expected at intake, then letting the remittance tell you where you were wrong, one payer at a time.
That loop is what turns each admission into evidence, and it is what the PayerLenz AR dashboard is built to run continuously rather than monthly.
- Billed, allowed, and paid are three different numbers, and the gap between each pair points somewhere different.
- An expectation recorded at intake is what makes variance measurable instead of anecdotal.
- Projected payment timing built from your own history beats an industry average, and should say which basis it used.
- A dashboard points to the question. It does not replace claim-level follow-up.
Three Amounts, Not Two
Billed is what your organization charged. Allowed is what the payer recognised under its adjudication. Paid is what the payer actually issued, subject to the claim and to patient responsibility.
Most reporting collapses this into billed against paid, which is where the diagnosis gets lost. The federal glossary definition of allowed amount is the middle term, and it is the one that tells you whether a problem is a pricing problem or a collections problem.
Keeping the stages separate is what lets the team look in the right place. A falling allowed percentage and a falling paid percentage are different failures with different owners.
What Each Signal Points At
| What you see | What to investigate |
|---|---|
| Billed amounts steady, allowed percentage falls | Payer pricing, coding, level of care, or methodology changes |
| Allowed amounts hold, paid percentage falls | Patient responsibility, offsets, underpayments, or unresolved claim activity |
| Open claims rise while volume is stable | Submission, adjudication, follow-up, or payer-cycle delays |
| Projected payments move into later months | Changes in your observed payment timing by payer |
| One month drops but trailing performance holds | Timing variance rather than an established trend |
None of these are answers. They are the difference between knowing something moved and knowing where to look, which is the part month-end reconstruction never gets to before the month ends again.
Projected Timing Uses Your History, and Says So
When open claims are likely to pay is a forecast built from your organization’s own remittance patterns, payer by payer, using the speed-to-pay you have actually observed rather than a category average.
Where your own history is thin on a given payer, the projection falls back to de-identified patterns from the broader pool. The useful part is that it tells you which basis it used, so a projection built on twelve of your own claims is not silently presented as though it were built on hundreds.
That is the same discipline a reimbursement benchmark carries. A figure that declares the evidence behind it can be argued with, and a figure that does not cannot be trusted.
Close the Loop You Opened at Intake
The comparison only works if something was written down before the claim went out. That is the discipline described in estimating revenue per admission, and it is the input this entire process depends on.
Compare the recorded expectation against billed, allowed, and paid on the closed claim. Over a few months that comparison tells you which payers your reads are reliable for and which ones need a live verification every time.
It also surfaces underpayment that would otherwise pass unnoticed. A claim that paid inside the expected range for its own cohort is working as designed. A claim that paid well below the low end of that range is a question worth raising with the payer.
A variance against an expected range is a reason to investigate, not evidence of an underpayment. The expectation describes what comparable claims have paid, and any single claim can legitimately fall outside it.
What the Dashboard Does Not Do
It points the team to the question. It does not replace claim-level follow-up, and it does not replace accounting reconciliation.
That boundary is worth stating plainly, because reporting tools are usually sold as though they remove work rather than redirect it. This one redirects it. The hours saved are the ones currently spent establishing what happened, not the ones spent fixing it.
Where a signal turns into a payer conversation, the evidence has to leave the building intact. That is what a billing director can use when asking a payer why reimbursement moved, and an internal average never survives that conversation.
The Operating Rhythm
Record the expectation at intake. Watch the three amounts rather than two. Investigate the signal the table points at rather than the number that moved.
Across several sites the same rhythm is what makes locations comparable at all, which is the argument for one rate standard across facilities rather than a reporting pack per building.
The claims and remittance exchanges underneath all of this run on the standard transaction sets that CMS documents under administrative simplification, which is why the data is consistent enough to compare across payers in the first place.
- Record the expected range and its support at intake.
- Track billed, allowed, and paid as three separate series.
- Check trailing performance before treating one month as a trend.
- Note which basis a projection used before relying on it.
- Do not collapse billed against paid and call it a reimbursement rate.
- Do not treat a single variance as an underpayment claim.
- Do not rebuild the claims picture from scratch at month end.
- Do not compare this month to an industry average instead of to your own history.
The Short Version
Expected versus actual is not a report. It is a loop that starts at intake and closes on the remittance, and the only thing that makes it work is writing the expectation down while it is still an expectation.
Why Track Allowed Separately From Paid?
Because they fail differently. A falling allowed percentage points at pricing, coding, or methodology. A falling paid percentage points at patient responsibility, offsets, or unresolved claim activity.
What if We Never Recorded an Expectation?
Then variance is anecdotal. You can start recording from today and have a usable comparison within a quarter, which is faster than most teams expect.
Is a Claim Below the Expected Range an Underpayment?
Not on its own. Any single claim can legitimately fall outside the range. A pattern of claims landing below the low end for their own cohort is the version worth taking to the payer.
How Is Projected Payment Timing Calculated?
From your own observed speed to pay, payer by payer. Where your history on a payer is thin, it falls back to de-identified patterns from the broader pool and tells you it did.
Start free with 15 historical searches at signup. No credit card required.
Get 15 Free Searches