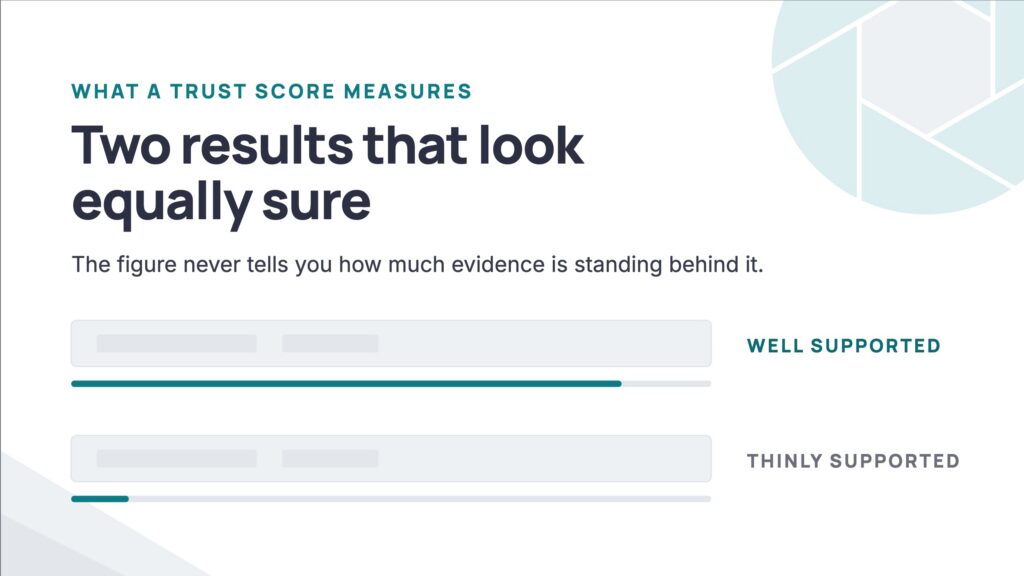
Two benchmark results sit side by side on the same screen. Both name a dollar figure for the same level of care. One is worth quoting to a family and the other is not.
Nothing about the dollar figures tells you which is which. The number that does is the trust score beside them, and it is the part of the result most likely to be scrolled past.
Every result in PayerLenz reimbursement benchmarks carries one. It is a 0 to 100 figure, and it exists so a thin result announces itself rather than hiding behind a polished average.
- A trust score is built from two inputs: how many adjudicated claims support the result, and how recent they are.
- Volume is log-scaled, so depth is rewarded without one enormous combination dominating everything else.
- A low score is a signal, not a defect. It tells the team to treat the figure as directional.
- The correct response to a low score is a live verification, not a more confident guess.
The Two Inputs, and Why Only Two
A 0 to 100 figure built from the volume of adjudicated claims supporting a result and the share of those claims from the last 12 months. It describes the strength of the evidence behind a benchmark, not the likelihood that a specific claim will pay.
Volume is the first input: how many adjudicated claims support the selected payer group, state, level of care, and reimbursement methodology. It is log-scaled deliberately, so a result backed by real depth scores well without a single enormous combination flattening everything around it.
Recency is the second: the share of those supporting claims from the last 12 months. A figure built mostly on recent claims is describing how a payer behaves now. A figure built mostly on old ones is describing how it used to.
There is no third input, and that is a choice worth noticing. Adding weightings for how much someone wants the number to be right is how confidence scores stop meaning anything.
What a High Score Does Not Mean
A high score means the result has stronger support. It does not mean the next claim will land on the figure, and it never will, because a distribution is not a prediction about a single claim.
A trust score describes the evidence behind a benchmark. It is not a probability that a payer will pay a given amount, and no score makes a benchmark a guarantee of payment.
This distinction matters most in the conversation where it is easiest to lose. A family asking what treatment will cost is asking for certainty, and the honest answer involves a range and the reason it is a range.
What a Low Score Is For
The instinct is to read a low score as the product failing to answer. It is the opposite. It is the product declining to overstate, which is the only behaviour that makes the high scores worth anything.
A lower score does not disappear behind a polished average. It tells the team to treat the benchmark as directional and to put more weight on a live verification or a payer confirmation before anyone commits.
That is a workflow instruction, not a disclaimer. When the score is low and the admission is large, the next step is a live VOB worked by phone rather than a more confident reading of a thin result.
Why Thin Results Are Suppressed Entirely
Below a certain point a result stops being reported at all rather than being reported with a low score. A figure drawn from too few claims, or from too few facilities, describes an arrangement rather than a market.
That floor is a de-identification control as much as a statistical one. The federal de-identification standard at 45 CFR 164.514 sets out why aggregate figures built on very small groups stop being safely aggregate, and the same logic applies to a rate cell built on one contributor.
The practical consequence is that the published set is smaller than the pool. That is the intended trade, and it is the reason a published figure can be read as describing more than one facility’s contract.
How to Read a Result in Practice
Read the score before the dollar figure. It takes a second and it determines what the dollar figure is allowed to be used for.
Then record both. An expectation logged at intake is only useful if the claim can be compared against it later, which is the job an AR dashboard built on your history does continuously.
Then read the spread. The most-likely rate starts from the all-time median and moves toward the recency-weighted median, and the P25 to P90 range around it shows where real claims fall, which a single midpoint cannot.
A well-supported result is also the version that holds up outside your own building. It is what a billing director can use when a payer is asked why reimbursement moved, which an internal average never survives.
Then check what is underneath. The reimbursement methodology behind a claim is what makes two results from the same payer differ by a multiple, and a rate-cluster breakdown shows each cluster’s share rather than blending them.
Public pricing data has the same interpretation problem without the same signals. CMS publishes guidance on using price transparency information that is candid about what those files can and cannot support, which is a useful comparison for what a confidence signal is actually doing.
- Read the trust score before the dollar figure.
- Escalate a low-scoring, high-value case to a live verification.
- Quote a range and its support, never a midpoint on its own.
- Record the score alongside the expectation you set at intake.
- Do not read a high score as a prediction about one claim.
- Do not treat a low score as a reason to distrust the whole result set.
- Do not average across results with different levels of support.
- Do not promise a family a figure the score does not carry.
The Short Version
A rate without its support is a rumour with a decimal point. The trust score is the part of the result that tells you which one you are holding, and reading it costs a second.
What Is a Good Trust Score?
Higher is better supported, and the useful question is what you intend to do with the figure. A score good enough to set an internal expectation may not be good enough to quote to a family without a live verification behind it.
Why Is Volume Log-Scaled Rather Than Counted Flat?
Because a flat count would let one enormous payer and level-of-care combination dominate every comparison. Log-scaling rewards genuine depth while keeping the score comparable across combinations of very different sizes.
Does a Low Trust Score Mean the Rate Is Wrong?
No. It means the evidence behind it is thinner, so it should be treated as directional. The figure may well be accurate; there is simply less behind it than a high-scoring result has.
Why Do Some Combinations Return Nothing at All?
Because below a floor a result describes an arrangement rather than a market, and publishing it would be misleading as well as identifying. Returning nothing is the correct answer in those cases.
Start free with 15 historical searches at signup. No credit card required.
Get 15 Free Searches