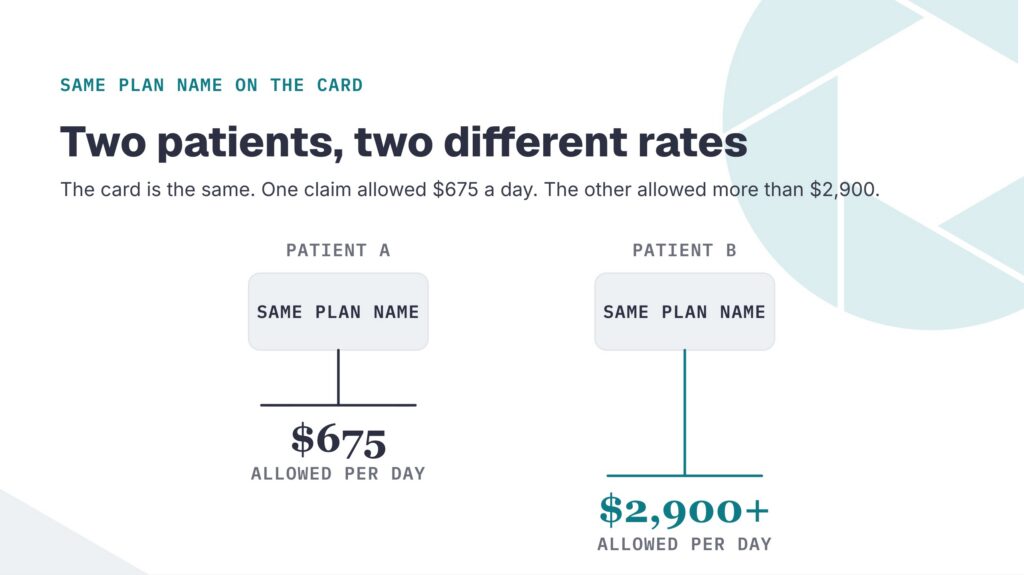
A biller pulls two EOBs from the same payer, for the same level of care, in the same state. One allowed $675 a day. The other allowed more than $2,900 a day.
Both admissions were verified before intake. Both verifications were accurate. Neither one predicted the number that arrived.
This is the most common unexplained variance in behavioral health revenue, and it is not random. Four variables move it, and three of them are knowable before a patient is admitted. PayerLenz reimbursement benchmarks exist because the fourth one is knowable too, just not from a verification.
- Two members of the same payer group can be reimbursed at rates that differ by more than four times for identical care.
- The card identifies the brand. The plan behind the card sets the pricing basis.
- Plan, state, level of care, and reimbursement method are the four variables that move the number.
- An accurate verification of benefits can coexist with a completely unexpected payment, because a verification does not return pricing basis.
The Card Says the Same Thing. The Plan Does Not.
Two patients present with cards carrying the same payer logo. To an admissions rep those look like the same coverage, and for the purpose of confirming that benefits are active, they effectively are.
For pricing they are not. A payer group is an umbrella over many separately designed plans, and out-of-network pricing basis is set at the plan level rather than the brand level.
That is why the useful unit of comparison is never the payer name. It is the plan that will adjudicate the claim.
Four Variables Move the Number
Across the benchmark pool the same four factors account for most of the spread. Plan, state, level of care, and reimbursement method.
Level of care and state are usually known at intake. Plan is knowable with a little work. Method is the one that hides, because eligibility transaction standards define what an electronic response must return and provider reimbursement basis is not part of it.
Level of care matters more than teams expect. The gap between residential, PHP, and IOP is not a proportional step down, because each sits on a different rate structure rather than a discount off the one above it.
State matters for two reasons at once. It changes which plan is likely to adjudicate, and it changes the local charge data that several pricing methods reference. The Medicare rates that other methods anchor to are published in the CMS fee schedules and vary by locality as well.
The consequence is structural rather than anyone’s mistake. Teams are asked to predict revenue from a data set that was never designed to carry the field that determines it. The transaction sets those responses conform to are maintained by the X12 standards body.
Why Blue Cross Is Not a Payer
Blue Cross Blue Shield is the clearest illustration. It is not one company but a federation of independently operated plans, each setting its own out-of-network policy.
A patient carrying a card issued in one state is frequently adjudicated by a plan in another. Averaging across the brand produces a figure that describes no plan that exists.
Resolving to the plan that actually adjudicates is the difference between a number that predicts something and a number that merely sounds specific.
What a Distribution Shows That an Average Hides
A single blended rate for a payer group is an average across every plan and every pricing method inside it. When the underlying populations differ by a multiple, their average sits in a gap where very few real claims land.
A distribution behaves differently. Reading the 25th, 50th, 75th, and 90th percentiles of claims that share the patient’s state, level of care, and method describes a range that real claims actually occupy.
It also shows you when the answer is weak. A wide spread across a small number of matched claims is a signal to go get more information, and an average would have concealed that entirely.
A benchmark is a description of what comparable adjudicated claims have paid. It is not a prediction for one claim, and it is not a guarantee of payment. Anything presented as a single certain number for a specific admission is overstating what claims data can support.
The Part That Is Not Knowable
Being straight about the limits is what makes the rest usable. Method narrows the range of plausible outcomes. It does not collapse that range to a point.
A carve-out still routes the claim to a different administrator. Authorization gaps still produce denials regardless of pricing basis. Deductible and out-of-pocket structure still determine how much of an allowed amount arrives as payment rather than patient responsibility.
The pool is also honest about its own thinness. Combinations that do not carry enough matched claims are filtered out rather than presented as market benchmarks, and every figure that is published carries the claim count behind it.
An active benefit tells you the door is open. It has never told you what is on the other side of it, and pretending otherwise is how a family gets a number that the EOB contradicts.
Kyle McHenry, Founder, Revenue Logic
Closing the Loop After the Claim
A rate expectation is only worth what it teaches you. The check is whether the claim landed where the range said it would.
Comparing billed, allowed, and paid against the expectation you recorded at intake turns each admission into evidence, which is the job an AR dashboard built on your history does continuously. Over a few months that comparison tells you which payers your reads are reliable for and which ones need a call every time.
It also surfaces underpayment that would otherwise pass unnoticed. A claim that paid inside the range is fine, and a claim that paid well below the 25th percentile for its own cohort is a question worth asking the payer.
How to Use This Before You Admit
The operational change is small and it happens at intake rather than at reconciliation, which puts it in the hands of the admissions team taking the call. Record the plan, not just the payer name, and record the pricing basis wherever the payer surfaces it.
Then treat that pairing as the unit that predicts revenue. A range drawn from claims sharing the patient’s plan characteristics is a materially different statement than a figure pulled from a fee schedule or a prior admission that felt similar.
For the cases where the electronic response comes back ambiguous, that is what a live VOB worked by phone is for. On a high-dollar admission the call pays for itself, and below that threshold it usually does not.
Why Do Two Patients With the Same Insurance Get Paid Differently?
Because the card identifies a payer brand, not a plan. Out-of-network pricing basis is set at the plan level, so two members of the same payer group can sit on different methods and be reimbursed at very different rates for identical care.
Can a Verification of Benefits Tell Me the Rate?
No. A verification confirms coverage status, deductible, and out-of-pocket detail. Electronic eligibility standards do not require a response to carry provider reimbursement basis, so the field that determines the rate is simply not in the answer.
Is Averaging Across a Payer Group Ever Useful?
For a rough sense of scale, yes. For predicting a specific admission, no. When the underlying plan populations differ by a multiple, their average sits in a range where few real claims fall.
How Much Claims Data Sits Behind These Ranges?
More than 500,000 adjudicated claims across 260 or more payer groups in 21 states, with 133,000 claim lines classified by reimbursement method.
Start free with 15 historical searches at signup. No credit card required.
Get 15 Free Searches